Greyhound Trap Draw Statistics UK
Best Greyhound Betting Sites – Bet on Greyhounds in 2026
Loading...
Trap Draw Stats — Where the Race Is Won Before It Starts
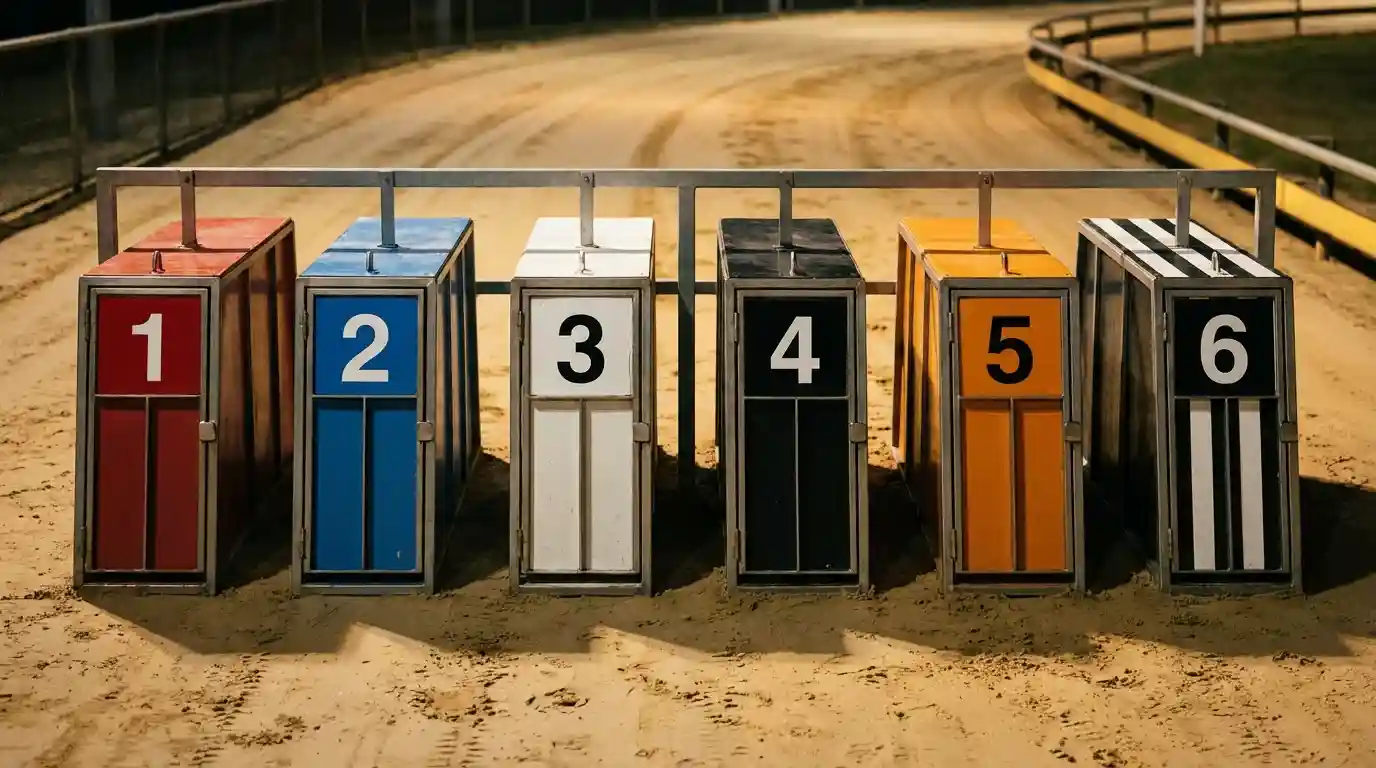
In greyhound racing, the starting position isn’t random. And neither should your analysis be. Every dog in a UK greyhound race is assigned a trap number from 1 to 6, and that number isn’t just a starting position — it’s a variable that influences the outcome of the race in ways that most casual bettors underestimate and most serious bettors build their entire approach around.
The trap draw determines where a greyhound starts on the track, which in turn determines its path into the first bend. On a tight oval circuit — which is what every UK greyhound track is — the first bend is where races are won and lost. Dogs drawn on the inside have a shorter distance to travel into that bend. Dogs drawn wide need to either show blistering early pace to get across, or accept that they’ll be pushed wide and lose ground. The maths is simple: if two dogs of equal ability run the same race, the one with the inside draw has a structural advantage.
That advantage isn’t theoretical. It’s measurable, it’s documented across thousands of races, and it varies significantly from track to track. Understanding trap draw statistics — and knowing how to use them without over-relying on them — is one of the most practical edges available to a UK greyhound bettor.
UK Trap Win Percentages by Track
National averages mean nothing. Track-by-track data is where the value lives. The aggregate trap win percentages across all UK greyhound tracks tend to show a gentle bias towards the lower-numbered traps — Traps 1 and 2 typically win slightly more often than Traps 5 and 6 when you lump everything together. But that aggregate hides enormous variation between individual venues, and it’s the venue-level data that actually informs betting decisions.
At a track like Romford, the inside bias is pronounced. Trap 1 at Romford has historically produced win rates well above the expected 16.7% (which is what you’d get if all six traps won equally). Over sustained sample sizes, Trap 1 at Romford can account for 20% or more of race wins at the standard distance. That doesn’t sound like a dramatic number until you consider the compounding effect over hundreds of bets — a 3-4% edge on trap selection alone shifts the long-term maths meaningfully in the bettor’s favour.
At Nottingham, the picture is different. The track’s wider circumference and more gradual bends produce a flatter distribution. Trap win percentages at Nottingham cluster more tightly around the 16-17% mark for each trap, with less separation between inside and outside draws. Dogs drawn in Trap 5 or 6 at Nottingham aren’t nearly as disadvantaged as they would be at Romford, because the geometry gives them more room to settle into the race without being pushed wide.
Monmore Green in Wolverhampton presents another pattern entirely. Sprint races at Monmore — particularly the 264-metre dash — tend to favour dogs with early pace regardless of trap, but the standard 480-metre distance shows a slight bias towards Traps 1 and 2 that’s consistent with most UK tracks. Sheffield’s Owlerton Stadium, with its distinctive galloping circuit, produces data that leans towards middle traps at certain distances, particularly in stayers’ races where the longer run to the first bend reduces the inside draw advantage.
Perry Barr in Birmingham historically showed solid inside-trap bias at the standard 480-metre distance, with Trap 1 and Trap 2 combining for a disproportionate share of wins. Note that Perry Barr closed in August 2025, with its greyhound racing operation relocating to Dunstall Park in Wolverhampton. Sunderland’s track, by contrast, is one of the tighter circuits in the UK and produces strong inside-trap numbers that echo Romford’s pattern, albeit with smaller sample sizes.
The data is freely available through the Racing Post’s form database, through GBGB race records, and through third-party form services that compile track-specific statistics such as Greyhound Stats UK. Any serious greyhound bettor should have access to at least one of these sources and should be checking trap statistics for their regular tracks as a matter of routine. The numbers update with every meeting, and seasonal patterns — wetter tracks in winter, faster sand in summer — can shift the bias subtly from month to month.
The key principle is specificity. Don’t ask “does the inside trap win more often in greyhound racing?” — the answer is yes, slightly, on average, and it’s not useful. Ask “what is the Trap 1 win rate at this specific track, at this specific distance, over the last 12 months?” That answer will be useful. And it will be different from the answer at the next track down the road.
Why Certain Traps Win More Often at Certain Tracks
Track geometry, bend tightness, rail position — it all feeds the trap bias. The reason trap draw statistics vary so much between UK venues is that no two greyhound tracks are identical. They share the same basic oval shape, but the specifics — circumference, bend radius, straight length, rail type, surface composition — create meaningfully different racing environments.
The first bend is the critical element. In a six-dog race where all runners break from standing traps, the field converges on the first bend within a few seconds. How tight that bend is determines how much advantage the inside-drawn dogs hold. On a track with sharp, tight bends, the inside rail is a significant asset. The dog in Trap 1 has the shortest path into the bend and can establish position before the wider-drawn dogs have the chance to cross. On a track with more gradual bends, the path difference is smaller and the inside advantage is reduced.
Track circumference matters too. Smaller circuits mean the bends arrive sooner after the start, giving inside dogs less time to be challenged before the geometry starts working in their favour. Larger circuits with longer straights allow wider-drawn dogs to use early pace to cross the field before the bend, neutralising some of the inside advantage.
The hare rail also plays a role, though it’s less discussed. In UK greyhound racing, the lure runs on a rail that sits inside the running track. Dogs naturally pull towards the rail because they’re chasing the lure. This creates a gravitational pull towards the inside of the track, which benefits inside-drawn dogs who are already closer to the rail and disadvantages outside dogs who have to navigate across traffic to get there.
Surface condition introduces a variable layer. Sand tracks — which is what all UK venues now use — can develop uneven patches over the course of a meeting. The inside running line, which carries the most traffic, can become chewed up by the halfway point of a card, making it harder for late-running dogs who follow the rail. In wet conditions, the sand becomes heavier and slower, which tends to amplify the inside draw advantage because cutting across the track through heavy sand costs more energy than it would on a dry, fast surface.
Distance is the final factor. At sprint distances (270m and below), the first bend arrives so quickly that the trap draw is often the decisive factor. There simply isn’t enough race for a wide-drawn dog to recover from a poor start. At standard distances (around 480m), the two bends give inside-drawn dogs two separate positional advantages, but there’s also enough race for quality to tell. At staying distances (600m+), the race includes multiple bends and longer straights, which gradually dilutes the trap draw advantage as other factors — stamina, temperament, running style — become more influential. For a full breakdown of distances at individual tracks, see the Towcester race distance guide.
How to Factor Trap Data Into Your Greyhound Bets
Trap stats shouldn’t replace form analysis. They should frame it. The most effective use of trap draw data is as a first filter — a structural overlay that tells you which dogs have a positional advantage before you even look at their form, and which dogs face a geometric handicap they’ll need to overcome with superior ability.
The practical workflow looks like this. Before studying the racecard in detail, check the trap statistics for the track and distance. Identify which traps have an above-average win rate. Then, when you assess each dog’s form, weight that assessment slightly in favour of dogs drawn in the high-performing traps and slightly against dogs drawn in the weaker positions. The adjustment doesn’t need to be dramatic. A dog with strong form in a weak trap is still a legitimate selection. A dog with moderate form in a strong trap deserves a closer look than its raw form numbers might suggest.
Where trap data becomes particularly powerful is in separating two or three closely matched dogs. If you’ve narrowed a race down to three contenders and they’re all priced similarly, the trap draw can be the tiebreaker. The dog drawn in the statistically stronger position gets the nod — not because the trap guarantees anything, but because over a long series of similar decisions, that marginal positional advantage compounds into a measurable return.
The trap to avoid is treating the data as gospel. A trap that wins 22% of races still loses 78% of them. An inside draw doesn’t override poor form, a bad running style for that track, or a dog that’s been off for weeks with an injury. The stats provide context, not verdicts. The bettor who backs Trap 1 in every race because “the stats say it wins most” will lose money as reliably as any other one-dimensional approach.
Use the data to inform, not to decide. Check it before every meeting. Let it shape your shortlist. Then do the actual work of reading form, assessing running styles, and evaluating whether the price reflects the true probability. The trap draw is the starting point of your analysis — literally and figuratively.
The Trap Is Just a Number — Until You Know the Track
Every punter looks at the dog. The smart ones look at the box first. Not because the box matters more than form — it doesn’t — but because the box tells you something that form alone cannot: the physical reality of where that dog will be when the traps open and the race begins.
A greyhound’s ability doesn’t change based on which trap it’s drawn in. But its opportunity to express that ability changes significantly. A fast dog in a favourable draw gets to use its speed cleanly. The same dog in an unfavourable draw might get crowded, pushed wide, or forced to check at the first bend. The form book will record both outcomes as runs, but the context is entirely different.
The discipline, then, is to learn your tracks. Know which traps produce winners at the venues you bet on regularly. Keep a note — mental or written — of the bias patterns and how they shift with distance and conditions. When you sit down to study a racecard, let the trap draw set the frame before the form fills in the picture. It won’t make you right every time. Nothing does. But it will make your analysis more complete, and in a sport where the margins between profit and loss are measured in percentage points, completeness is the edge.